Richest Counties in Illinois (2026)
by Kristen Carney
Updated: February 9, 2026
Richest County in Illinois
The richest county in Illinois is Lake County with an average household income of $155,726 as of 2024 and 714,223 people as of 2024 according to the most current Census data available (citation).
| Rank | County | Population | Average Income | Median Income |
|---|---|---|---|---|
| 1 | Lake County | 714,223 | $155,726 | $110,416 |
| 2 | DuPage County | 930,024 | $152,117 | $112,096 |
| 3 | Will County | 701,462 | $134,181 | $109,984 |
| 4 | Kane County | 517,255 | $131,975 | $103,163 |
| 5 | McHenry County | 312,591 | $130,520 | $104,802 |
| 6 | Kendall County | 137,675 | $129,379 | $111,601 |
| 7 | Monroe County | 35,036 | $123,402 | $102,880 |
| 8 | Cook County | 5,182,090 | $120,717 | $83,498 |
| 9 | Piatt County | 16,695 | $113,102 | $94,811 |
| 10 | Grundy County | 53,219 | $111,828 | $92,235 |
| 11 | Woodford County | 38,312 | $110,925 | $91,483 |
| 12 | Clinton County | 36,954 | $108,402 | $86,588 |
| 13 | Boone County | 53,230 | $106,291 | $84,571 |
| 14 | Calhoun County | 4,330 | $105,834 | $93,203 |
| 15 | McLean County | 171,556 | $105,003 | $79,905 |
| 16 | Sangamon County | 194,947 | $100,226 | $75,357 |
| 17 | Effingham County | 34,522 | $99,682 | $80,404 |
| 18 | Madison County | 264,238 | $98,419 | $75,793 |
| 19 | Jersey County | 21,274 | $98,416 | $80,361 |
| 20 | Ogle County | 51,495 | $98,173 | $82,132 |
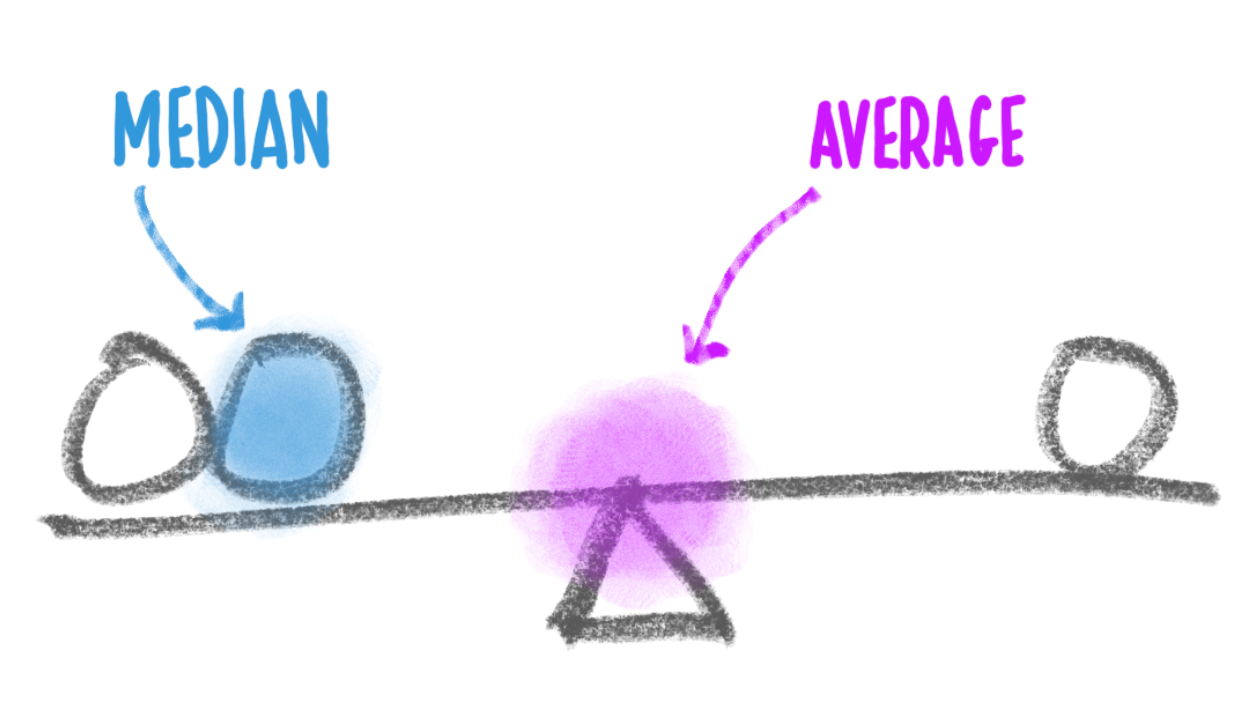
Median Income versus Average Income: Which Should You Use?
We usually suggest using median income data – either instead of or in addition to – average income data as a true indicator of wealth. If you haven’t thought about median versus average since your last standardized test, you aren’t alone. Here’s what they are:
- average is the sum of a set of numbers divided by the count of numbers in the set
- median is the middle number in the set of numbers
Now let’s say you had the following simplified set of income data.
Household 1: $30,000
Household 2: $50,000
Household 3: $1,000,000
The average income for this set is $360,000. The outlier data point ($1,000,000) skews the average WAY up. Conversely, the average income would be skewed WAY down if someone had an income of $500. The median income for the same data set is $50,000. Outlier data doesn’t skew the median.
Most Business Owners Should Use Median Income
So most business owners should use the median income as a true indicator of wealth, because it provides a more accurate representation of a typical income, especially in areas with significant income disparity.
When Should You Use Average Income
If your target market is high-income households, the average income may be more relevant. This is because the average income can highlight the presence of a higher concentration of wealthy individuals, which is beneficial for luxury goods and services marketing. We’re using average income on this page because using the Census’s highest reported median value of $250,001 could result in multiple ties for the richest geography.
Why do so many cities have a median value of $250,001?
The Census' American Community Survey uses $250,000+ as a jam value for median income estimates to protect privacy, ensure data consistency, and simplify reporting. A "jam value" in survey data refers to a placeholder or default value used when actual data points are unavailable, incomplete, or exceed certain thresholds. We represent this jam value as $250,001 to make it easy for you to sort.
You might also be interested in:
Email Me When New Data Are Released
Join thousands of subscribers and receive just 1 (ONE!) email a year in December when the US Census Bureau releases new income data for Illinois richest counties.
SOURCES
United States Census Bureau. Annual Estimates of the Resident Population: April 1, 2020 to July 1, 2024. U.S. Census Bureau, Population Division. Web. May 2025. http://www.census.gov/.
United States Census Bureau. B01001 SEX BY AGE, 2024 American Community Survey 5-Year Estimates. U.S. Census Bureau, American Community Survey Office. Web. 29 January 2026. http://www.census.gov/.
United States Census Bureau. B19013 Median Household Income, 2024 American Community Survey 5-Year Estimates. U.S. Census Bureau, American Community Survey Office. Web. 29 January 2026. http://www.census.gov/.
United States Census Bureau. “DP03 SELECTED ECONOMIC CHARACTERISTICS.” 2024 American Community Survey 5-Year Estimates. U.S. Census Bureau, American Community Survey Office. Web. 29 January 2026. http://www.census.gov/.
Products & Services
Plumbing
Connect
- 1-800-939-2130
- Contact Us
© Copyright 2026 Cubit Planning, Inc.